Budget Season: 4 Ways to Communicate Your Facility Management Team’s Value
During budgeting season, funds get distributed in a lot of different ways. Sometimes it is based on immediate needs. Some organizations give surplus funds away on a round-robin schedule. For some, it is just who complains the most. No matter how your organization decides, facilities are always low on the totem pole. Often this comes down to facilities leadership not being able to effectively communicate their value, leading them to be overlooked when it comes to funds for projected needs.
To get the dollars you need in your budget this year, you’ll need to communicate your department’s data-backed results and the long-term impact the necessary funds will bring your organization. Here are four data-driven ways to showcase your team’s hard work and dedication.
1. The Landscape of Your Facilities
The first thing to look at when you’re assessing your department is the state of your facilities. The size, use, age, and condition of your structures impact what your team needs to be successful. When you’re presenting a budget, make sure to highlight not just the condition of assets, but also the risk they pose to help put your requests into perspective. For instance, if they held off on replacing a large asset last year(s), remind them. The longer the list gets, the more expensive asset failures can become and the higher the risk to your organization.
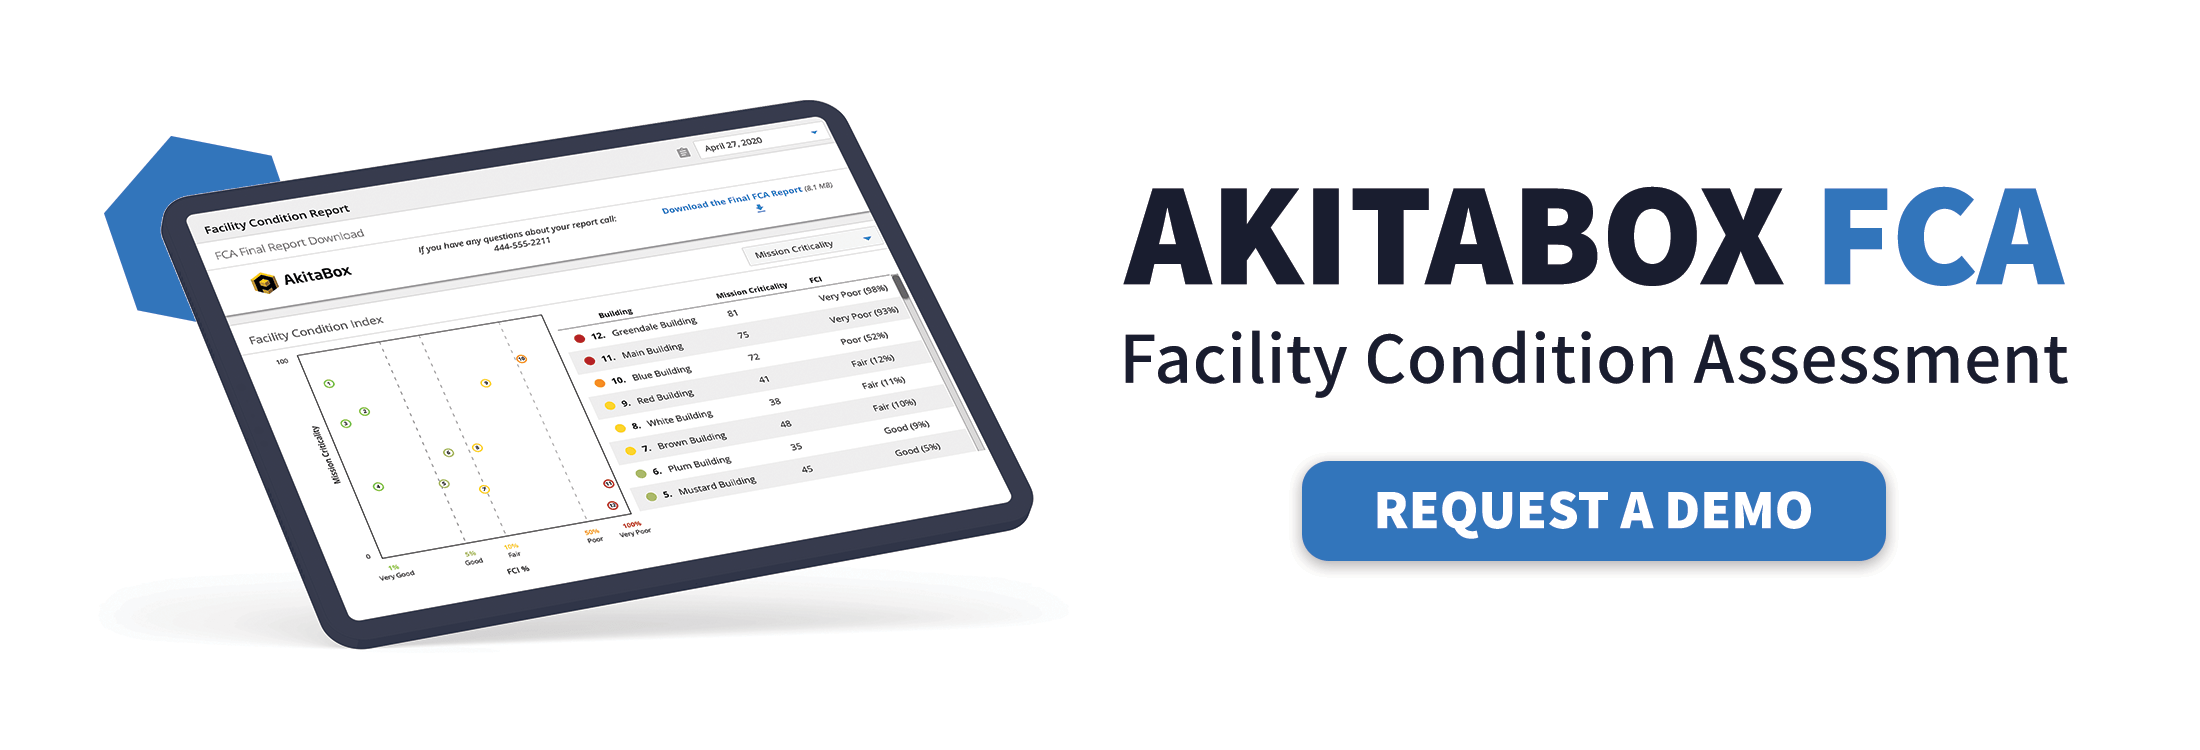
If you’re having trouble getting them to invest, consider hiring a third-party team or performing your own facility condition assessment (FCA); this can provide data showing what your team is trying to manage. This approach will include a cost, but it could help you earn credibility for larger budget requests. You’ll also have a base-plan for future projects based on this data.
An easy way to coordinate this assessment of your building portfolio is to document feedback and link related files to assets on a floor plan with facility management software. Some facility software vendors even have permissions designed for third parties so they can update information directly in the software platform. There are also capital planning solutions that can help you more accurately predict facility needs and better communicate your needs with your budget holders.
2. Team Functions and Tasks
How granular you need to get into your team’s functions and tasks depends on how familiar your leaders are with your facility’s operations and the sheer size of your facilities and workforce. An easy way to simplify this information for the leadership team is by relating all tasks and objectives to your team’s department goals. One common goal is fulfilling a Service Level Agreement, which is a response-time promise facility managers can make to an organization for submitted service requests or work orders.
The Service Level Agreement is a goal the leadership already understands, so if you frame data and goals around this common ground, you’ll better convey why the requested resources are necessary for top-tier staff performance. To find this performance data, look to your facility management software for data articulating:
- Staffing Structure: Define how many employees you have, how much square footage they’re responsible for maintaining, and the hours it takes to accomplish their various tasks.
- Employee Workload: If your staffing structure data is inconsistent with work output and these employees aren’t able to effectively manage their duties, workload metrics will help define why. For instance, if you’re having trouble maintaining your Service Level Agreement and it’s not a personnel issue, amending zones and calculating square footage, possibly due to inaccurate floor plans, could help reduce these unintended delays. This data can also show which teams have higher expectations, what type tasks they do most often and who has time for more proactive than reactive maintenance.
- Opportunities for Improvement: With KPIs in hand, discuss challenges your team has and support these arguments with data. For instance, instead of saying a boiler is old and asking for a replacement, compare its age to average boiler life expectancy, share the previous and projected maintenance costs if it isn’t replaced and discuss potential related downtime. If you don’t have enough personnel, discuss the current work hours going into tasks, when preventative maintenance is delayed or isn’t completed and how much that could cost the organization in the long run. Data makes your points stronger.

3. Certifications and Training
Your leadership team is familiar with the challenges of attracting and retaining millennials in the workforce, and they hopefully understand how critical professional development opportunities are to this group. Although determining the return on investment (ROI) of training, certifications and strong leadership is difficult, describing what you’re doing through certifications and unofficial mentorship programs for these employees will help them understand its importance. Investing in your employees has the obvious benefit of having a better, more educated team, but it also helps reduce turnover and make replacing retiring employees easier, which can cost thousands of dollars.
Another way training supports your company is by defining and implementing a strong FM culture. This leads to more empowered employees who understand how to do their job, and also the values and actions that are expected from them. They also bring less risk to a company, since they are trained on how to do things correctly with the correct safety equipment, which should decrease injuries or unintended exposure to harmful materials. Overall, employees who feel invested in will be more team-oriented and more likely to help correctly train future talent.
4. Performance Data
If you’re looking to get started, consider the following key performance indicators (KPIs) to share with your leadership team. Annual data is best, but any data is always better than none.
- Number of Assets Maintained: Even though your leadership team may think they know the facility like the back of their hand, many critical assets, such as plumbing, electrical and mechanical assets, go unrecognized because they’re designed to blend into their surroundings or are in areas of a facility your occupants don’t normally visit.
- Find this number: A facility management software can export a report of how many assets you have, in addition to the number of different assets you maintain. If the data is outdated or you can’t remember the last time this information was updated, you will want to start with collecting accurate data.
- Number of Work Orders Completed: Articulating the volume of what your team does provides a more complete picture to leaders. If you’re experiencing staff shortages, you can also use the number of high-, medium- and low-priority work orders you haven’t been able to get to during the day to articulate the problem. In addition, these numbers can be segmented by intent, such as preventative or reactive maintenance, to show areas you’re working to improve on.
- Find this number: This total is available in your facility management software dashboard, but you can also filter the data by intent, status and others for a more granular picture.
- Average Time to Complete a Work Order: Besides the numbers of work orders completed, the average time it takes to complete them shows if your team is appropriately staffed for the work they’re assigned to.
- Find this number: Export facility management software data and create an average to find this number.
- Number of Service Requests Completed: Leadership and occupants are more likely to have experience with service requests, so showing the number of service requests completed in relation to the total number of work orders is an easy way for them to mentally scale your workload. If you’re experiencing challenges meeting your Service Level Agreement, you can also use the number of service requests you haven’t been able to respond to during the day to articulate the problem.
- Find this number: This total is available in your facility management software dashboard.
- Average Time to Complete Service Requests: Just like why you want to show the average time to complete a work order, showing the average time it takes to complete a service request shows how your team spends its time. It also helps your leadership team understand any challenges with the Service Level Agreement.
- Find this number: Export facility management software data and create an average to find this number.
Accessing data in your facility management software is the cornerstone of a good budget proposal, but it can also be an Achilles’ heel if your system isn’t easy to use. To learn about a better, easier way to access this information, reach out to our team and we’ll be able to help you start communicating your team’s value.
Find more resources for facility management budgeting here.